HUBSPOT ANALYTICS
See What’s Working. Fix What Isn’t.
HubSpot Analytics turns your CRM into a crystal-clear source of truth. That means no more wondering which channel drove that last deal. No more fighting over marketing attribution. No more spreadsheets duct-taped together to tell half a story.
Whether you’re in marketing, sales, or service, HubSpot gives you the tools to understand your full funnel performance, from first touch to final sale and beyond.

WHAT IS HUBSPOT ANALYTICS?
HubSpot Analytics is a native reporting suite embedded across every Hub – Marketing, Sales, Service, and Operations. It goes beyond surface-level data to give you a holistic view of your pipeline, performance, and ROI.
With customizable dashboards, lifecycle tracking, behavioral insights, and built-in attribution modeling, it’s built for teams who want clarity and valuable insights.
WHAT CAN YOU TRACK WITH HUBSPOT ANALYTICS?
Traffic Analytics
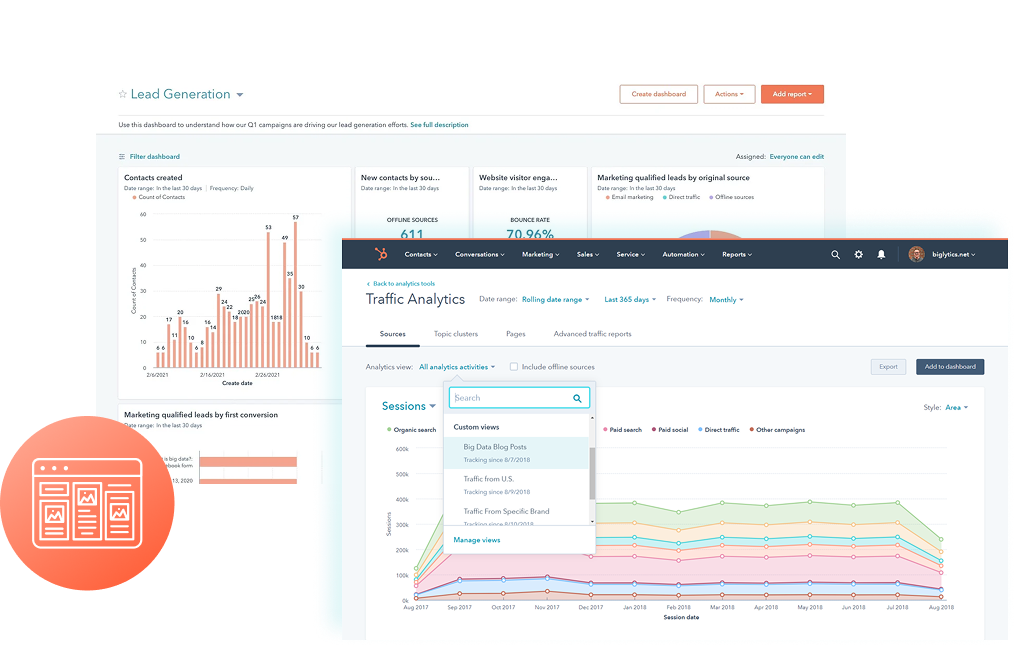
Understand where your visitors come from, what pages they engage with, and how long they stay.
- Sessions by source (organic, paid, direct, referral)
- Bounce rate & session duration
- Top landing pages by conversion rate
Campaign Analytics
Monitor every asset tied to a campaign and track how it contributes to pipeline.
- Influenced contacts
- New leads generated
- ROI by email, blog, CTA, ad, and more
Workflow Performance
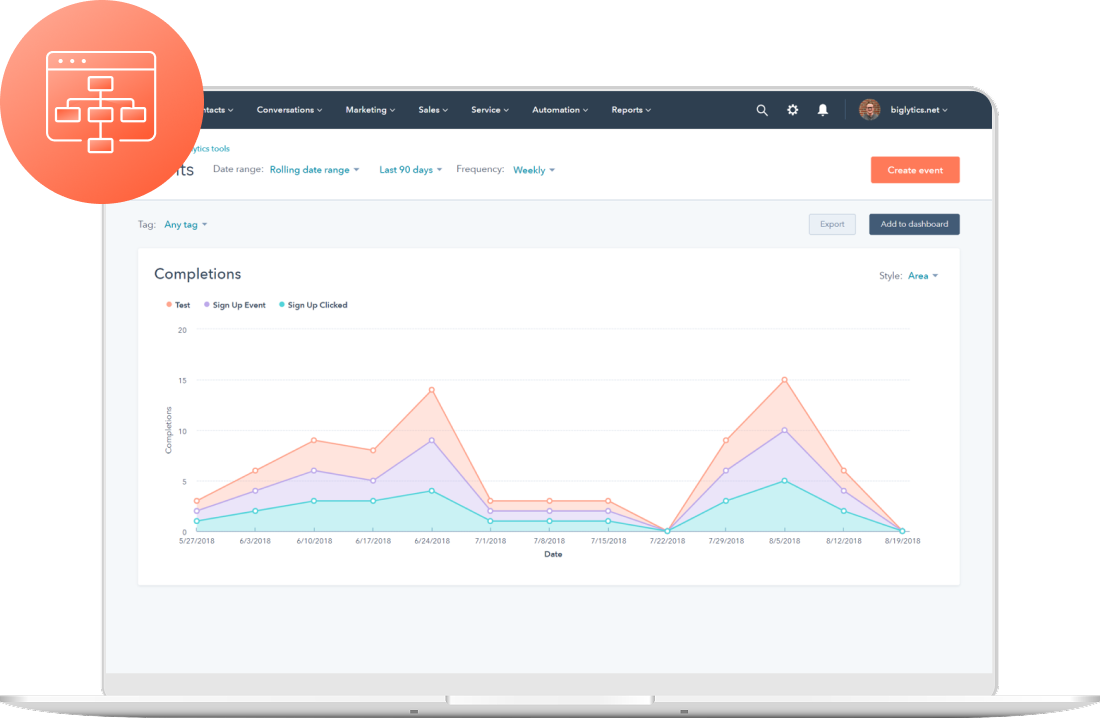
Get a flashlight on your automation. See how people move through workflows and where they drop off.
- Enrollment rates
- Email performance
- Goal completion & branch effectiveness
Sales Funnel Reporting
Track how leads convert—or stall—at every stage.
- MQL → SQL → Opportunity → Closed-Won
- Conversion rates by lifecycle stage
- Deal velocity and sales cycle length
Attribution Reporting
Find out what influenced the deal.
- First-touch, last-touch, U-shaped, W-shaped, and time-decay models
- Channel and campaign contribution
- Full-funnel ROI insights

VANITY METRICS VS VALUE METRICS
Not all data deserves a spot on your dashboard. If a metric doesn’t help you make a business decision, it doesn’t belong in your reports.
Vanity Metrics:
Email open rate
Impressions
Social likes
Value Metrics:
Lead-to-customer rate
CAC (Customer Acquisition Cost)
CLV (Customer Lifetime Value)
Influenced revenue
Deal close rate
BUILD DASHBOARDS THAT DRIVE REAL ACTION
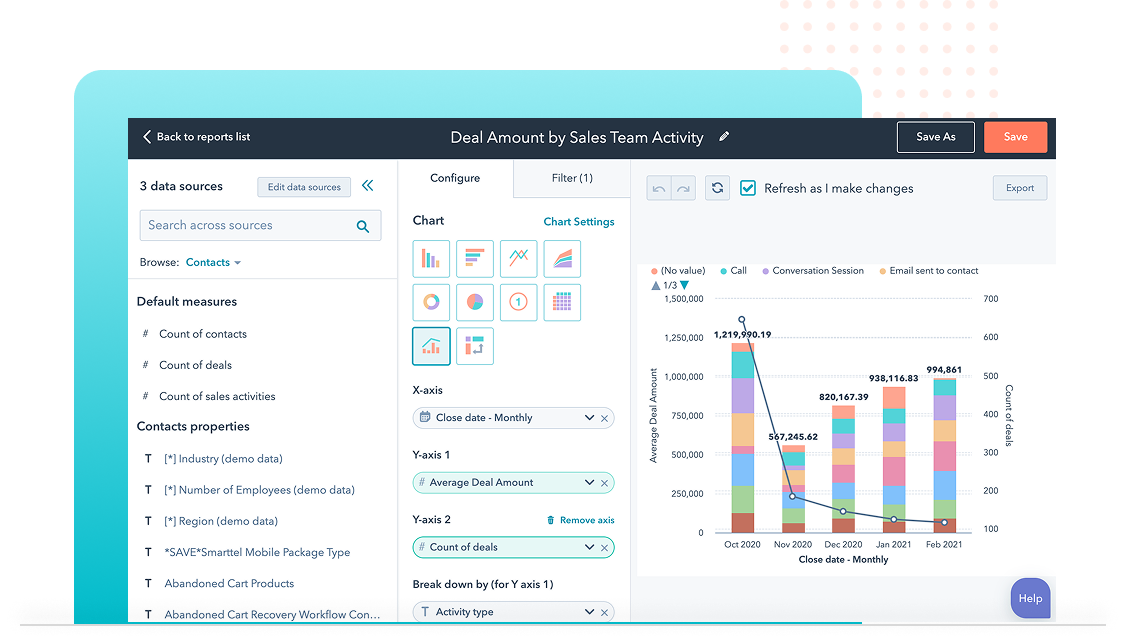
Whether you’re in marketing trying to prove campaign ROI, sales tracking deal velocity, or leadership monitoring pipeline health, custom dashboards let you surface the insights that matter.
Instead of forcing every team to sift through the same generic reports, you can tailor views for each department, automate delivery on a schedule, and keep everyone aligned without manually exporting a single spreadsheet.
HubSpot gives you the framework. You decide what story to tell and who needs to hear it.
Best Practices:

Start with a question important to your business

Limit dashboards to 5–7 core reports

Use filters (timeframes, campaigns, teams)

Set goals and track progress over time

Automate report delivery weekly or monthly
TURNING ANALYTICS INTO ROI
With HubSpot, you’re connecting the dots between effort and outcome. Every campaign, every workflow, every contact touchpoint can be tied back to revenue, giving you the clarity to make smarter investments and the proof to back them up.
Whether you’re defending your budget, optimizing spend, or aligning marketing and sales on what’s working, HubSpot’s analytics tools turn guesswork into measurable impact.
HERE'S HOW
Marketing Attribution
Which channels and campaigns bring in real customers?
Revenue Reporting
What’s your true cost per lead or per deal?
Customer Analytics
How long do customers stay, and how much do they spend?
When you can tie every campaign and workflow to revenue outcomes, you stop guessing and start scaling.
HUBSPOT ANALYTICS HIDDEN GEMS YOU SHOULD BE USING
There’s more under the hood on HubSpot than most teams realize. Here are some of our favorite hidden gems to found within HubSpot Analytics:
-
Behavioral Event Tracking
Custom actions like demo clicks, pricing page visits, or repeat logins -
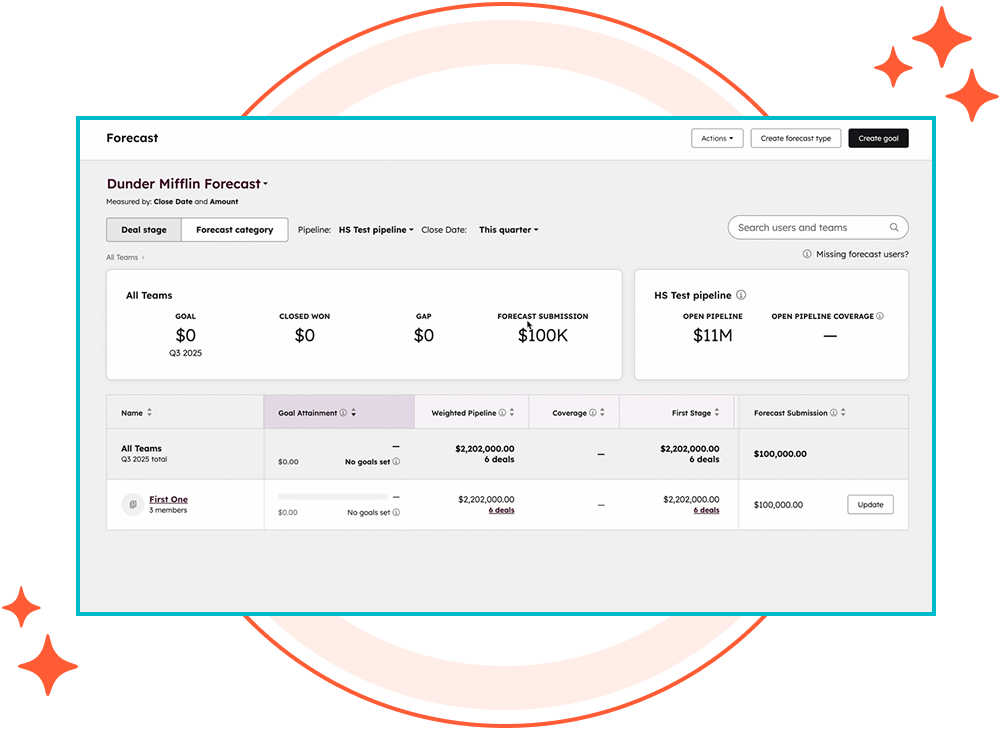
Forecasting Tools
Predict future sales based on pipeline trends and deal velocity -
NPS & Customer Feedback Reports
Track sentiment, satisfaction, and service quality -
Data Sync & Integrations
Pull data from Salesforce, Google Ads, Stripe, and more into your analytics

READY FOR A
BETTER HUBSPOT EXPERIENCE?
We’re a HubSpot Elite Partner with a team of data-savvy marketers, revenue ops pros, and CRM strategists. We make HubSpot dashboards work for your business and help accomish your sales and marketing goals. Even if you’re starting fresh or untangling messy reports, we’ll help you:
Build goal-driven dashboards
Implement custom attribution models
Align reporting across marketing and sales
Automate stakeholder reporting
Prove ROI—clearly, consistently, and confidently
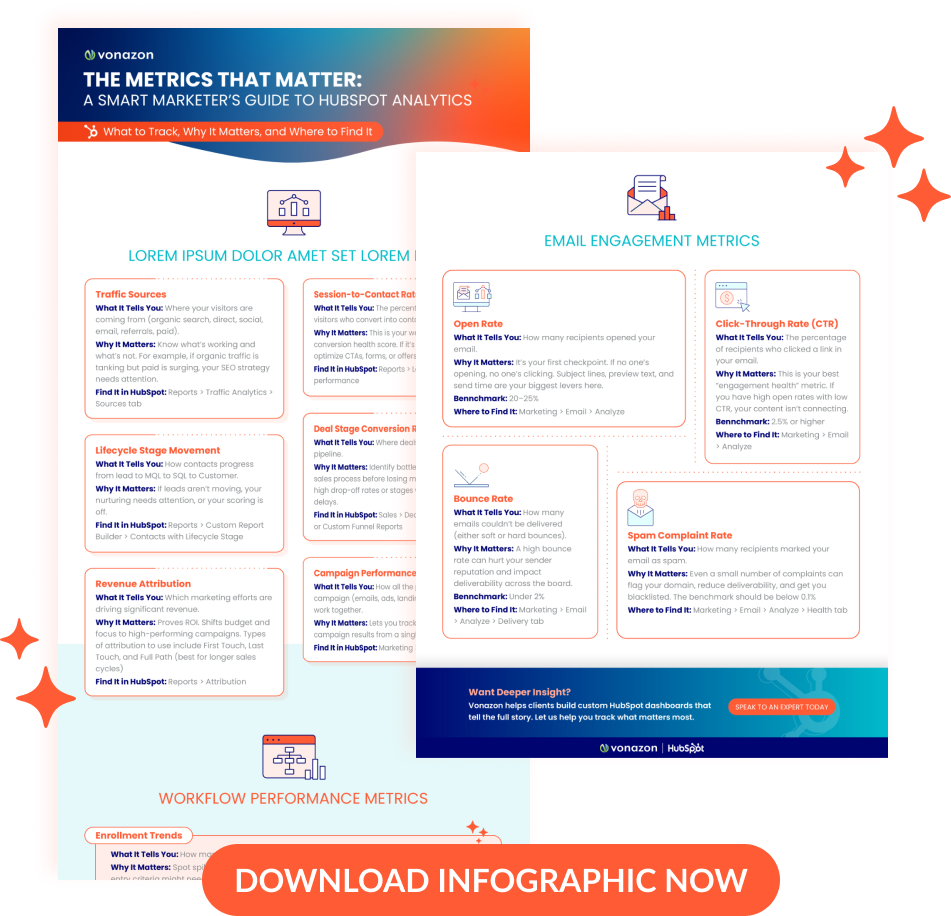
GET OUR HUBSPOT METRICS THAT MATTER GUIDE FOR FREE
If you’ve ever wondered which metrics in HubSpot truly matter, and which ones are just dashboard noise, this infographic has your answer. The Metrics That Matter: A Smart Marketer’s Guide to HubSpot Analytics is a visual cheat sheet designed to help teams focus on the data that actually drives performance, revenue, and decision-making.
Instead of overwhelming you with vanity stats and vague KPIs, it zeroes in on the core analytics categories that fuel real business insights. From traffic trends and lifecycle progression to deal conversions and workflow effectiveness, this guide helps you understand where to take action.
Even better, it shows you exactly where to find each metric within the HubSpot platform. That means less hunting through menus and more time optimizing your strategy.
LET'S BUILD HUBSPOT SMARTER REPORTING TOGETHER
Stop guessing and start scaling, we’re ready to help.

